About Regional Impact Scores:
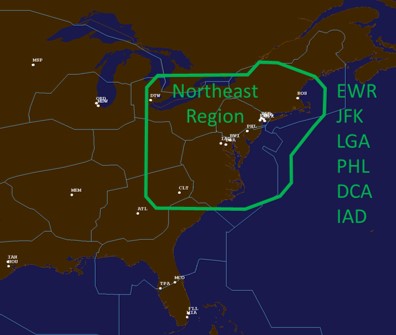
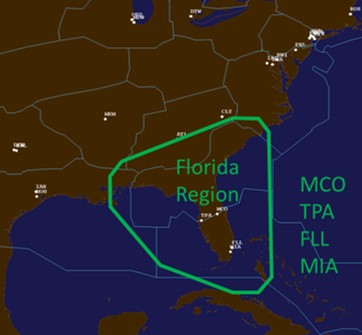
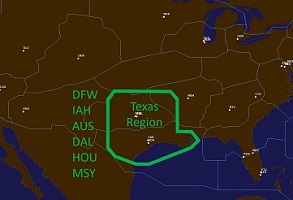
Regional weather impact scores are computed in a similar manner to our other weather impact scores except for a predefined region. Each region is defined as a weighted collection of airspace and airports which are a prime focus of national air traffic management planning/actions when severe weather threatens the region. Forecast impact scores are generated for the next day using 12Z forecast data and updated hourly during the Day of Operations starting with 8Z and at the conclusion of the Day of Operations the “actual” weather impact score is generated using observed data. These scores are computed for each hour and the ‘Early Day’ & ‘Primetime’ 8-hour time periods. Score values are assigned based on comparing to a five-year historical distribution (2020-2024) using the percentile ranges shown to the right.
Regional Impact Scores
Please enter dates in U.S. format (Month/Day/Year). No data prior to Jan. 2, 2017.
Submitting a new date will replace the Regional Scores table.
- 10: Above 98th Percentile
- 9: Between 95th and 98th Percentile
- 8: Between 90th and 95th Percentile
- 7: Between 80th and 90th Percentile
- 6: Between 70th and 80th Percentile
- 5: Between 60th and 70th Percentile
- 4: Between 45th and 60th
- 3: Between 30th and 45th Percentile
- 2: Between 15th and 30th Percentile
- 1: Less than 15th Percentile (but greater than 0)
- 0: No impact


